Vela: UX/UI Design For a Weather App
Vela is a coastal weather tracker for water sports enthusiasts. It aims to provide accurate and easy to understand tidal, wave and weather reports for surfers, sailors, divers and other water sports aficionados. Vela is a responsive web app with a mobile-first approach.
My Role: UX/UI Designer
Timeline: May-October 2019
Company: CareerFoundry

The Problem
Water sports enthusiasts lack reliable and well-organized weather data to make their outings on the water safe and enjoyable. The existing tools either offer fragmented information, or overwhelm users with irrelevant data.
Solution
A coastal weather tracker, which allows users to create customized weather reports tailored to their favorite open water sport.

Research & Interviews
I gathered 64 survey responses, interviewed 5 users and did some improvised social media research in order to understand user needs, pain points and behavior context.
Using affinity mapping, I sorted through over 80 user insights to identify the key ones.

Findings
52%
Practice more than one sport
71%
Are male
40%
Agree that accurate weather data is more important than the visuals
User Personas
I created two user personas to reflect members of Vela’s key demographics: high-energy young people (“Ashley”) and mid-career professionals, who are busy raising families but haven’t lost a taste for adventure (“Glen”).
Initially, I considered another group of users: retired people, who like to spend their free time practicing aquatic sports. However, it turned out that members of this group tend to be very experienced and either opt for advanced subscription-based software or take pride in doing things the old-school way. I decided this was an edge case.


User Journeys
Next, I created user journey maps and user flows in order to better understand what Ashley and Glen might be thinking and feeling as they use Vela to achieve their goals.
The research phase revealed two main user pain points, which became central to the MVP:
1) find a way to visualize weather data in a clear and intuitive way;
2) provide only the data most relevant to the user’s preferred activity
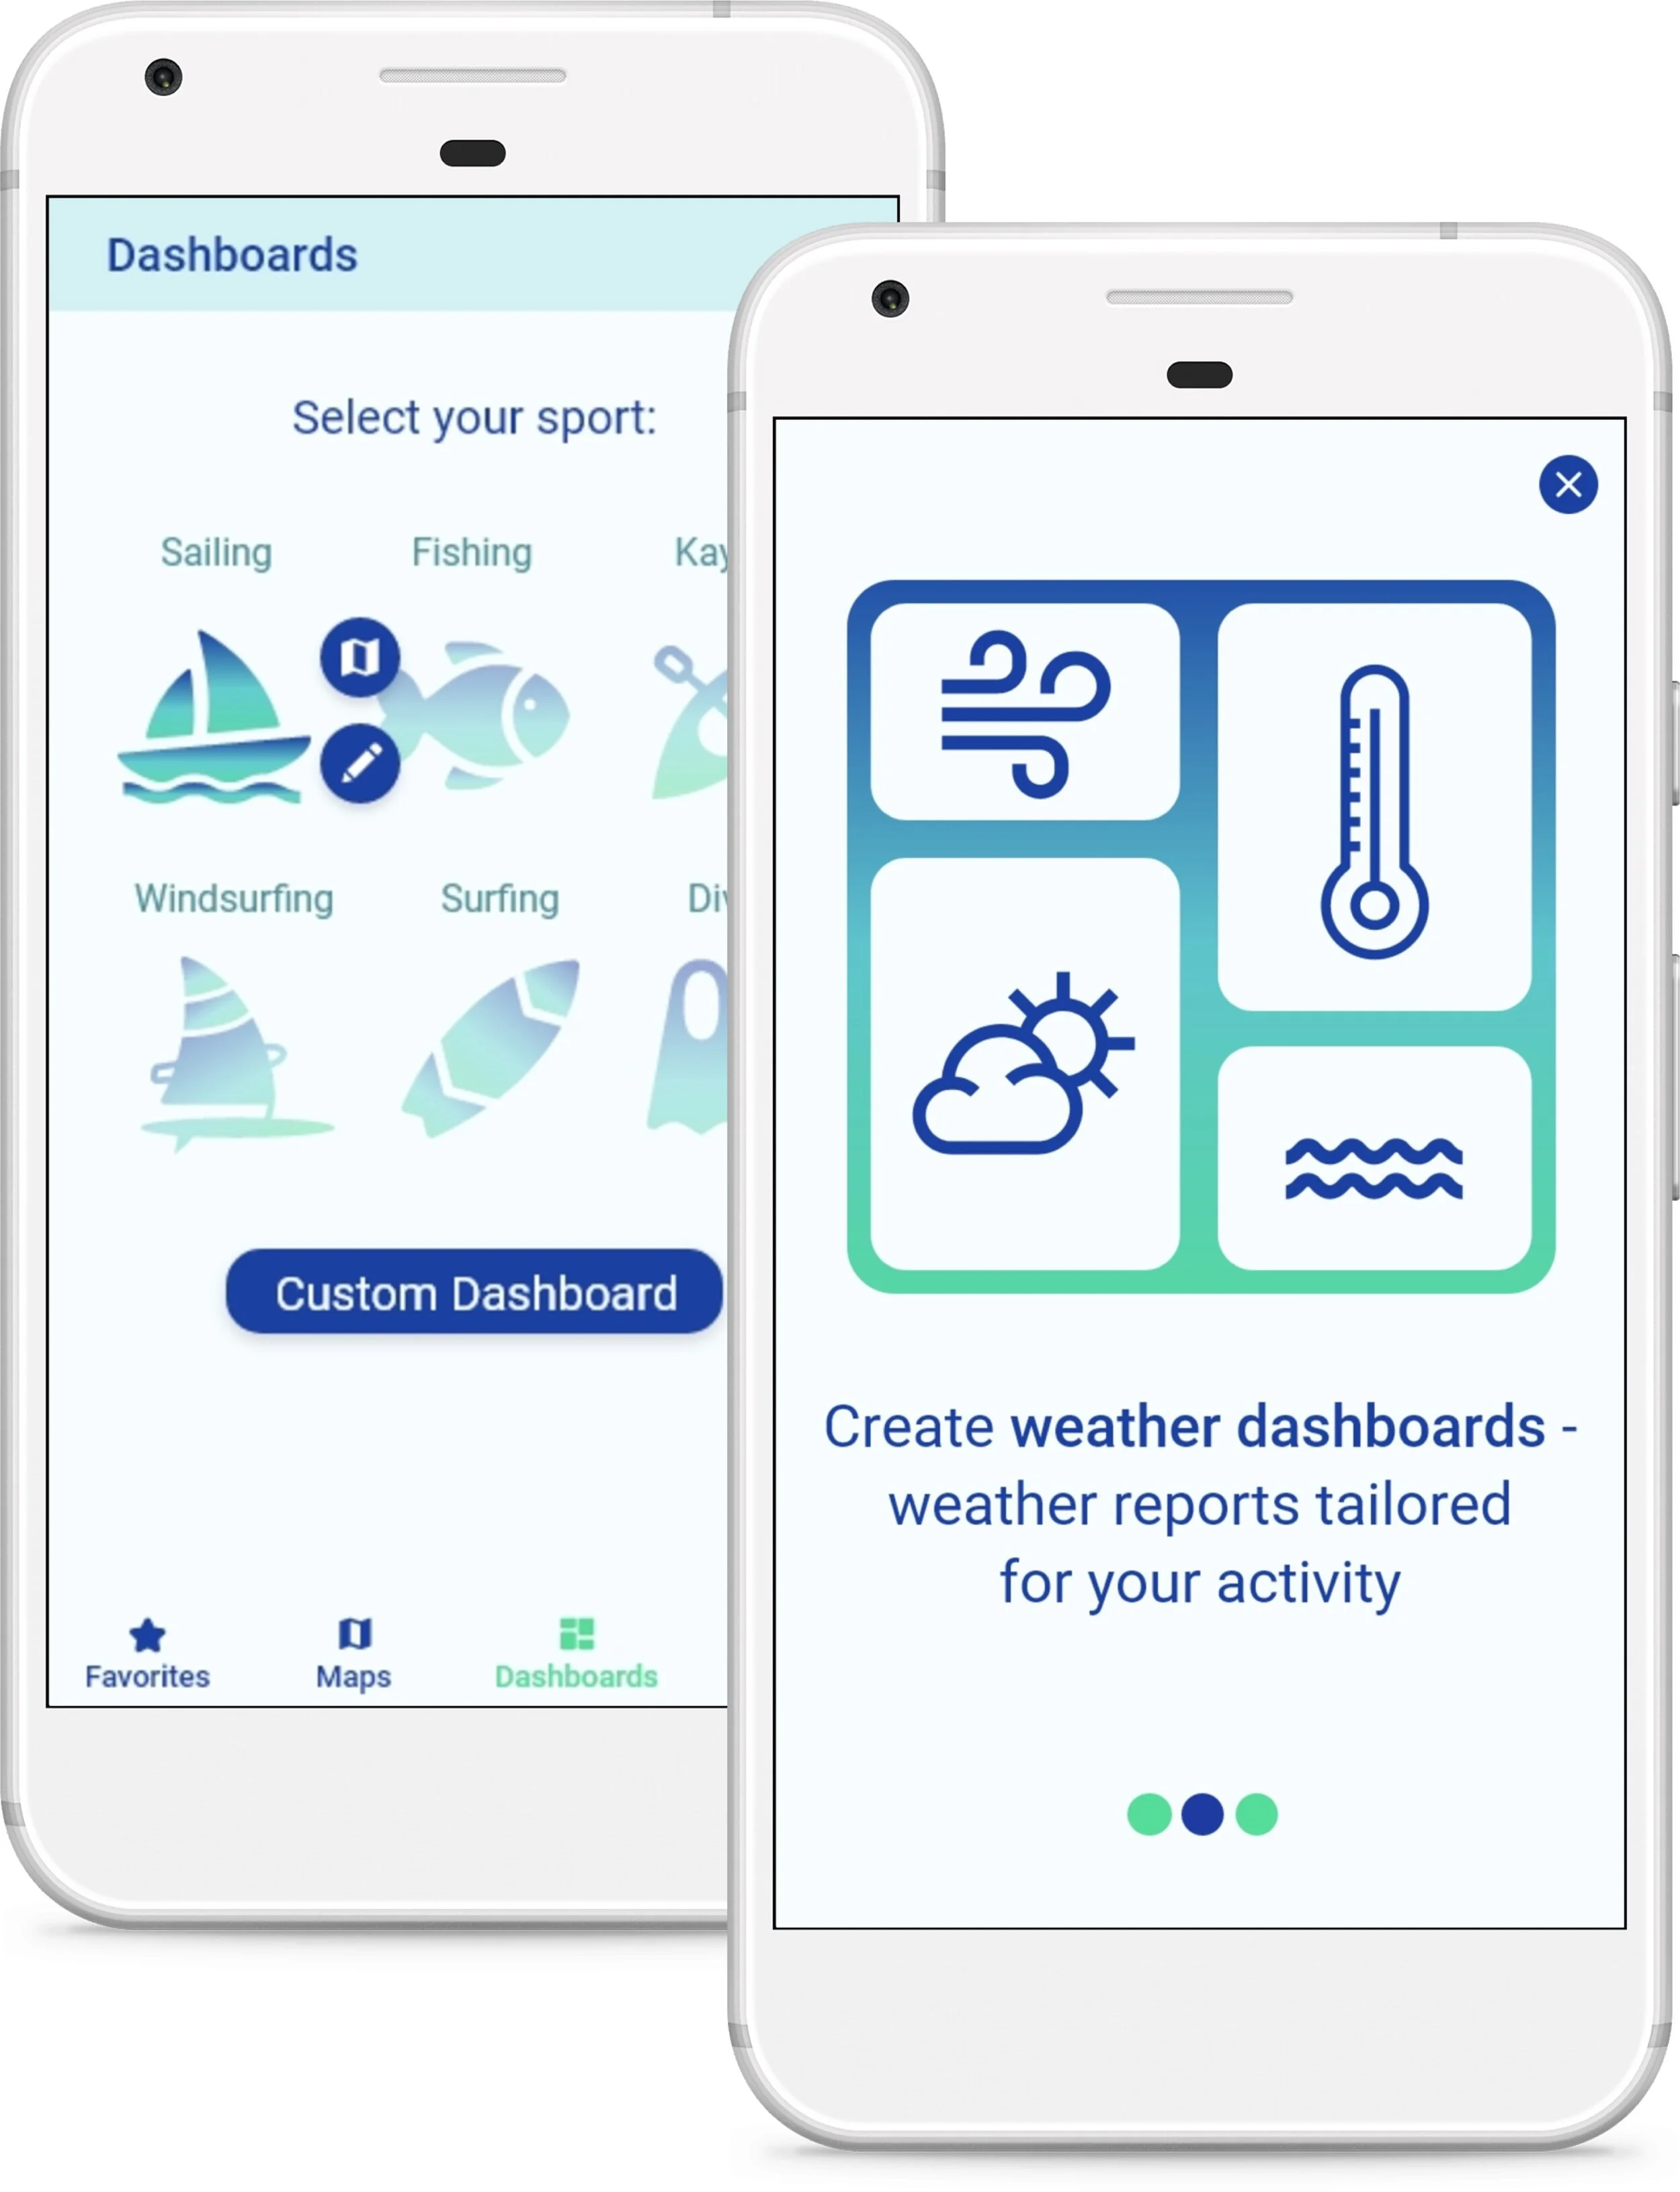
That’s how I came up with the concept of weather dashboards - customized weather reports.


Wireframes & Prototyping
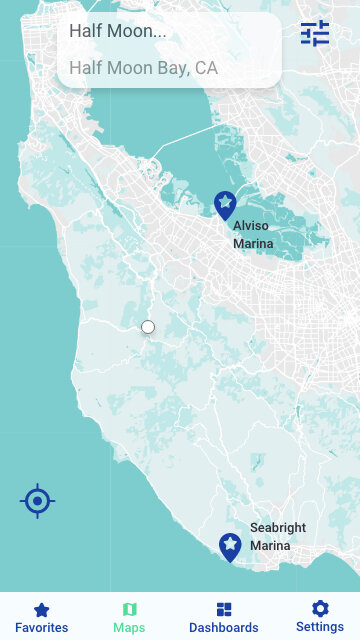
As the next step, I created sketches and wireframes to illustrate several key user flows: searching for a location, creating a customized dashboard and using the dashboard to assess weather conditions.


Instead of using a static table or a chart to represent the data, I introduced a forecast timeline linked to the weather data. As the user slides their finger along the timeline, the data changes to reflect the forecast.
At first, I also envisioned the dashboard as a mask over the map with its ‘window’ centered on a desired location.
Guided by user feedback, I abandoned this idea in favor of a ‘data tray’, which can be minimized to free up space for easier map surfing.


Usability Testing
I conducted a series of usability tests to assess how well the users understood the app and whether they found it useful. I asked respondents to complete onboarding, search and favorite a location, create a dashboard and use it to compare two locations. Next, I used affinity mapping again to extract insights and visualized them in a rainbow spreadsheet.
Review & Iterations
During usability testing, the only user error (and most other feedback I received) related to the dashboard function. Users liked the idea of a customized weather report, but failed to apply this novel functionality.
To solve this problem, I changed the onboarding imagery to better familiarize users with the dashboards before they began using the app. I've also included icon labels in the action bar and visual hints at what the users were expected to do next.
A series of preference tests confirmed this was a valid approach by showing improved user recognition.